When a Meta Ads campaign fails to generate qualified leads, the problem is rarely solved by looking only at the final number of leads generated. A lead, by itself, is not enough to determine whether the account is performing well, whether the budget is being invested efficiently, or whether the funnel is breaking down at a specific stage.
To properly evaluate a campaign, you need clear indicators. Some show how many people are being reached, others measure traffic efficiency, and others help determine whether advertising spend is generating a sustainable return.
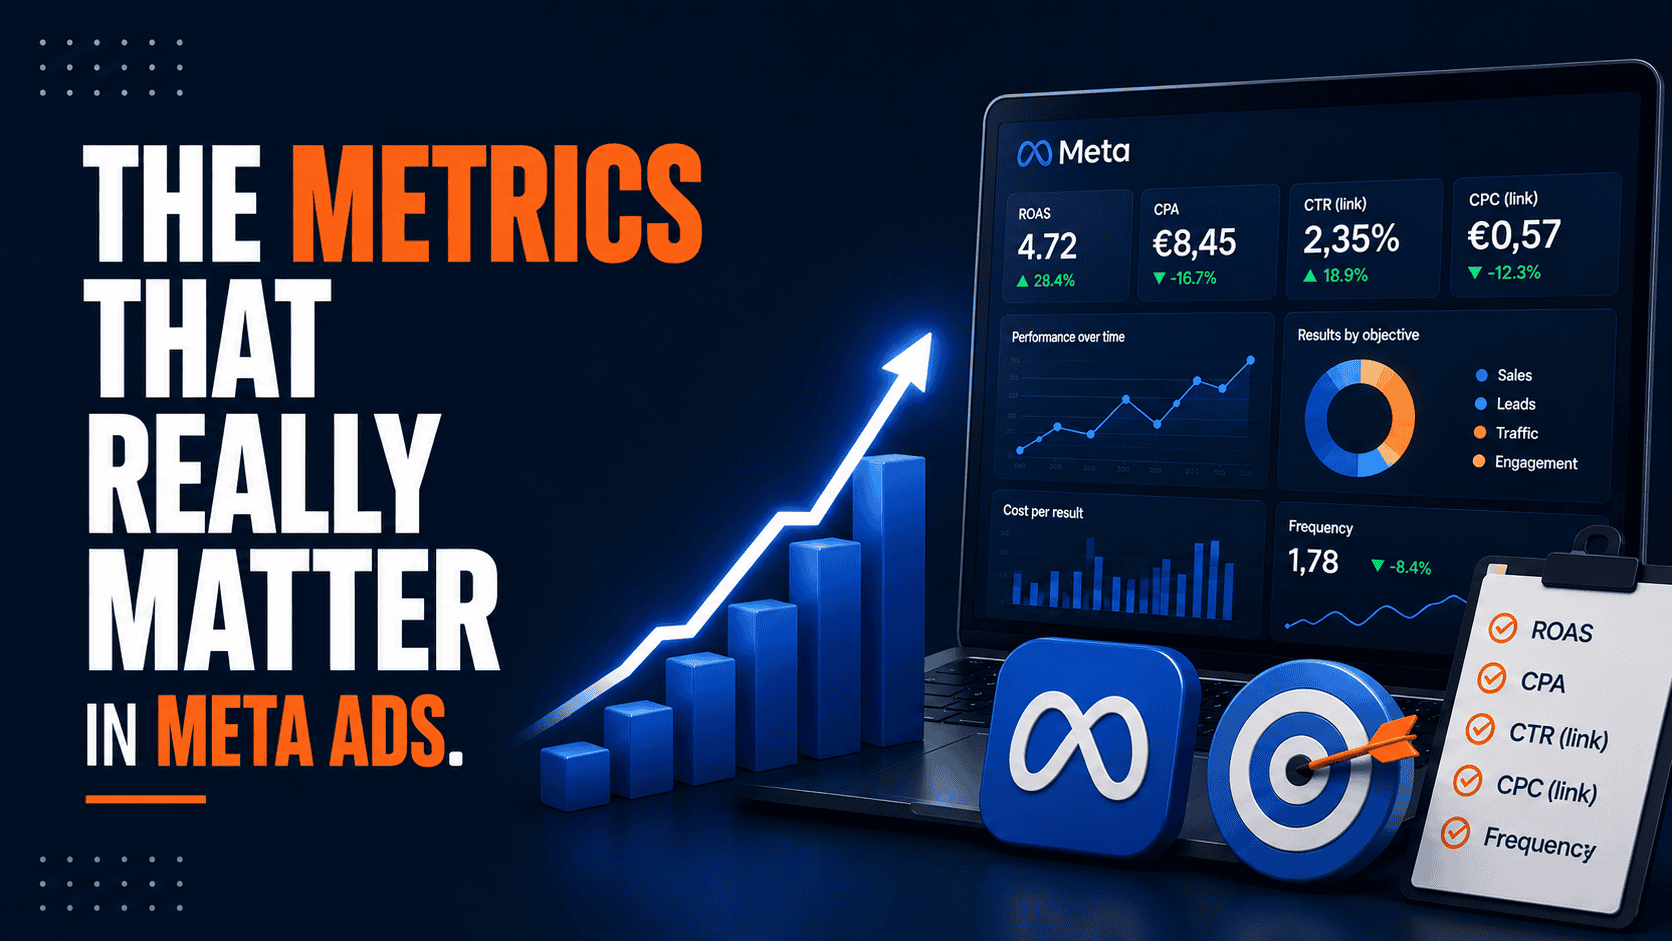
The five fundamental metrics to monitor in Meta Ads are Reach, Impressions, CPC, ROAS, and CPA. Analyzing them together makes it easier to identify exactly where opportunities are being lost and what is truly consuming the budget.
Why Counting Leads Isn’t Enough
Many campaigns are judged exclusively by the number of leads collected. This approach is limiting because it only captures the final outcome without explaining the process that produced it.
If lead volume is low, the issue could stem from weak creatives, poor targeting, an excessively high cost per click, an ineffective landing page, or an offer that lacks perceived value. Without monitoring intermediate metrics, it’s easy to intervene too late—or in the wrong place.
A proper analysis of campaign data enables faster and more effective decisions. This is what separates campaigns that waste budget from campaigns capable of generating predictable results.
1. Reach: How Many Unique People Saw the Ad
Reach measures the number of unique users who have seen an ad at least once.
It is an exposure metric that helps determine the actual size of the audience reached by the campaign.
This metric is particularly useful for evaluating:
- The size of the audience effectively reached
- The campaign’s ability to generate visibility
- The balance between audience coverage and exposure frequency
Reach alone cannot determine profitability, but it represents the first layer of analysis. If very few people see the ad, the rest of the funnel starts with a significant disadvantage.
2. Impressions: How Many Times the Ad Is Displayed
Impressions measure the total number of times an ad is shown.
Unlike Reach, every exposure counts—even when the same person sees the ad multiple times.
Comparing Reach and Impressions provides valuable insights into how frequently the audience is being exposed to the creative.
When Impressions are significantly higher than Reach, it means some users are seeing the same ad repeatedly.
This can have different implications:
- Increased message recall and memorability
- Audience fatigue and declining performance
- A sign of an audience that is too small or inefficient budget distribution
Monitoring Impressions helps evaluate not only visibility but also the advertising pressure being applied to the target audience.
3. CPC: How Much Each Click Costs
CPC, or Cost Per Click, indicates the average amount paid for each visit generated by the ad.
It is one of the most immediate metrics for evaluating campaign efficiency during the traffic generation stage.
A lower CPC generally suggests greater efficiency, while a higher CPC can signal issues such as:
- Weak creative assets
- Unclear messaging
- Poor audience definition
- Increased competition in the ad auction
CPC should never be evaluated in isolation. A cheap click is not automatically a valuable click if it fails to generate meaningful actions. However, it remains a critical metric for understanding whether traffic is being acquired efficiently.
4. ROAS: Return on Ad Spend
ROAS measures the revenue generated relative to advertising spend.
It answers one of the most important questions in advertising:
How much revenue is being generated for every dollar or euro invested?
The higher the ROAS, the more profitable the campaign.
ROAS helps businesses:
- Evaluate overall campaign profitability
- Compare different ad sets or offers
- Determine whether advertising spend is sustainable over time
Although it is particularly important for sales-driven campaigns, the underlying principle applies to all advertising strategies: marketing investment only makes sense when the return aligns with business objectives.
5. CPA: How Much It Costs to Acquire a Lead or Customer
This metric plays a critical role in campaign planning because it reveals whether customer acquisition costs are sustainable.
CPA helps businesses:
- Determine whether a campaign is financially viable
- Evaluate whether acquisition costs align with profit margins
- Plan future budgets with greater accuracy
When CPA becomes too high, the problem is not necessarily the ad itself. Friction may exist within the conversion process, the offer, or the quality of the traffic being generated.
How to Analyze These Metrics Together
The true value of these indicators emerges when they are viewed as a system rather than individually.
Looking at metrics in isolation often leads to incomplete conclusions. Analyzing them together allows marketers to identify exactly where performance is breaking down.
A simple framework might look like this:
- Low Reach: the campaign is reaching too few people
- High Impressions relative to Reach: the audience may be experiencing ad fatigue
- High CPC: traffic acquisition is inefficient
- High CPA: conversions are too expensive and require deeper investigation
- Low ROAS: revenue does not justify advertising spend
This type of analysis helps determine whether the bottleneck lies within the creative, targeting, landing page, or offer itself.
Where Meta Ads Campaigns Actually Break Down
When results decline, the most common reaction is to change everything at once.
In reality, underperforming campaigns should be analyzed stage by stage.
The metrics above help answer practical questions such as:
- Is the ad reaching enough people?
- Is the audience seeing the ad too frequently?
- Does the message motivate users to click?
- Is the traffic cost acceptable?
- Are visitors becoming leads or customers at a sustainable cost?
- Does the final return justify the investment?
When these questions are answered with data, optimization becomes significantly more rational and effective.
The Metric You Shouldn’t Ignore: Drop-Off
Alongside the five core metrics, there is another indicator that deserves increasing attention: drop-off.
Drop-off helps identify where users abandon the journey.
It is no longer enough to know how many people enter the funnel. You also need to understand how many leave and at which stage they exit.
This makes drop-off a strategic metric for uncovering hidden performance losses that traditional reporting often misses.
Conclusion
In Meta Ads, lead volume alone does not tell the full story.
To accurately evaluate a campaign, you must examine the signals that precede and support conversions.
Reach and Impressions reveal distribution. CPC measures traffic efficiency. CPA shows the true cost of acquisition. ROAS determines whether advertising spend is generating an adequate return.
That deeper level of analysis is what leads to smarter optimization, more predictable results, and stronger long-term campaign performance.